
A selection of our current and past customers are briefly described here. We support small installations and measurement envíronments (Deutsche Flugsicherung GmbH) as well as mid-size (GRZ IT Center GmbH) up to large installations (IBM NGN Competence Center).
The section Screenshots presents the different analysis possibilities with the help of concrete usage examples.
The section Presentations provides slides and articles we contributed to some conferences.
- Customers
- Screenshots
- Presentations
- C# .NET
- for their financial client software
- Java
- for their application server (WebSphere) and servlets which implement the main financial services.
- C/C++
- for middleware components like HTTP-Servers
- Specification for the time period to be analyzed.
- Show measurement for a specific system.
- Restrict shown measurements to those with response times above threshold.
- Measurements according to filter criteria with coloured ARM status.
- A specific measurement has been selected (highlighted).
- Statistical information for ARM transaction CDDB-Query.
- Response time overview for a set of correlated measurements. Root transaction "HTTP" and several child transactions are displayed as rectangles with different background colours.
- Percentage distribution of response times per ARM transaction.
- The sequence chart showing which application called which functionality within a complete distributed environment:
- The root measurement HTTP (also called transaction in the context of ARM) is drawn on the left side of the chart inside the httpd application box (myarm.info).
- It calls the CDDB-Request of the PyCDDB application.
- The PyCDDB application connects (DB-Connect) to the CDDB database.
- Fetches the discs (Fetch-Discs) ...
- ... and tracks (Fetch-Tracks).
- Finally, generate the output (Generate-Output).
- On the right side of the chart the box with light blue background shows all context properties of the root transaction (here HTTP).
- On the right side of the chart the box on the bottom shows a legend which displays each transaction name with its used color.
- Specific measurement has been selected (and highlighted).
- Detailed information associated with the selected measurement.
- Transaction hierarchy with response time thresholds and a tree depth limited to 3 levels.
- Percentage distribution of response times per ARM application.
- Filter by dissecting an URI matching the pattern "/cgi-bin/py%".
- A reduced table with results is shown, notice the "/cgi-bin/" in the column labelled "Identification".
- Response time overview diagram with hover over DB-Connect.
- Detail information for DB-Connect after clicking on corresponding box (brown box in left diagram).
- A threshold for the response time has been set (25ms).
- In the results table, the cells below "Identification" have been drawn with a color according to the application (see box with "Transaction distribution").
- In the results table, the cells below "RT" have been drawn with a color according to the sigma interval the measurement belongs to.
- Response times per application with associated colours. Used in the first column in the results table.
- Transaction statistics (over all transactions) with color coding for five intervals. Used in the next-to-last column. Four of the measurements are slower than the mean value.
- Response time distribution according to transaction. The colours in the pie chart are also used in the results table (below "Identification").
- All widgets at the left (configuration and filter menus) have been hidden so there is more space for the results table (the Identification column can be quite large).
- The widgets at the bottom (the diagrams) have been hidden.
- In the upper part some CDDB HTTP requests are shown with their start date and time, total response time and execution status (GOOD) executed on myarm.info.
- In the lower part there is an overview of the response time distribution of the selected (grey) row from (a) shown.
- The root measurement HTTP also (called transaction in the context of ARM) is drawn on the bottom of the diagram.
- Any child transaction CDDB-Request of HTTP is drawn on top of it. Therefore a tree of transactions are shown with the leafs, here the Fetch-Tracks on the top.
- On the top of the diagram the so-called response time overlay is shown. This overlay depicts the response time distribution at a glance.
- In the upper part some CDDB HTTP requests are shown with their start date and time, total response time and execution status (GOOD) executed on myarm.info.
- In the lower part there is an overview of the response time distribution of the selected (grey) row from (a) shown. Also a grid (only with vertical lines) is rendered within the response time distribution diagram with a distance of 10ms.
- The user selected with the mouse the first Fetch-Tracks measurement (ARM Transaction). The legend shows the start time relative to the root measurement (HTTP), the response time and status of the transaction. The details of the selected transaction is shown in (d).
- The Details-Tab on the right side displays any details of the selected Fetch-Tracks transaction. The light blue highlighted attributes are user defined context values.
- In the upper part some CDDB HTTP requests are shown with their start date and time, total response time and execution status (GOOD) executed on myarm.info.
- In the lower part there is an overview of the response time distribution of the selected (grey) row from (a) shown.
- On the right a pie chart shows the overall response time distribution of the HTTPtransaction tree. The red pie part represents the sum of response times of the Fetch-Tracks measurements shown in (d).
- The individual Fetch-Tracks response time measurements.
- We want to analyze transactions of the type HTTP.
- The context property named "QueryString" shall contain a value starting with the string "artist".
- A slow HTTP transaction with a response time greater than two time the mean value (see "Transaction statistics").
- A custom sequence diagram for the measurement selected in the results table, all transactions are on ARM system myarm.info.
- Time axis starting at 0ms, same height as start of HTTP transaction drawn as lilac box. Transaction runs in application httpd.
- After about 40ms, the child transaction CDDB-Query starts in the application PyCDDB.
- The transactions DB-Connect and Fetch-Discs are started sequentially.
- Finally, several tracks are fetched as identified by the transaction Fetch-Tracks.
- The root transaction finishes after 261ms.
- Displaying the context properties of the root transaction.
- The drop down box shows us that there are 3881 measurements for the transaction HTTP in the database (in the selected time-frame).
- Six measurements match our "Context properties" filter.
- All diagrams show hovers with additional information pertaining to the element under the mouse pointer.
- Details are shown for transactions when clicking on their corresponding boxes in the diagram (DB-Connect in our example).
- Measurements shall be filtered first by System and then by Application.
- 8218 measurements are in the database for the selected system myarm.info.
- 8072 of the measurements are in the database for the application httpd (out of 8218 previously selected measurements).
- Two of the shown measurements have the status FAILED.
- One measurement has status ABORTED.
- Measurements shall be filtered first by System and then by Application.
- 8218 measurements are in the database for the selected system myarm.info.
- 8072 of the measurements are in the database for the application httpd (out of 8218 previously selected measurements).
- Using Transaction attribute filters: Show transactions with status equal to "FAILED".
- All transactions shown in the results table now have status "FAILED".
- RTS-Browser time period to aggregate statistics for
- Coloring controls to adjust cell colors
- Group names used for grouping transaction statistica
- Transaction statistics with average response times and indicating cell color
- The transaction names to present statistics for
- The response time average for each month and transaction
- Time navigation buttons to browse one month into the future or into the past
- Buttons to drill down into the appropriate month
- Days are grouped into five working day and two days weekend by adding some margin between these days.
- Days with no data are rendered in darker gray
- On April 30th the no disc entries are fetched and the DB-Connect are rendered red, maybe there is a problem with the database?
- Within this day nobody queried for REM
- Within the night no measurements were recorded
- DB-Connect transaction seems to have some problems
- Grayed tab-buttons are opened, none grayed tab-buttons can be clicked to launch the appropriate web-application (here RTSMonitor).
- Here the browser tab is shown.
- Parallel 2012 MyARM presentation

- View the slides of the Parallel 2012 MyARM presentation:
- QualityConf 2011 MyARM presentation
- View the slides of the QualityConf 2011 MyARM presentation:
- CMG 2007 MyARM Phoenix ARM instrumentation presentation
- View the slides of the CMG 2007 MyARM presentation:
- CMG2007 MyARM Phoenix ARM instrumentation paper
- Read the CMG 2007 ARM instrumentation paper:
Current
IBM NGN Competence Center

The IBM NGN Competence Center develops Next Generation Network (NGN) software for access and operating of IP- and VoIP-networks of a notable national und international Internet Service Provider (ISP).
MyARM (C/C++ Edition) is used within IBM NGN Competence Center for development and system test of essential server components of a big ISP access platform running under Linux and zLinux (around 20 Servers) to rate and verify non functional aspects (response times, load).
During test deployment complete calling hierarchies are recorded for later analysis. Especially RADIUS-, SOAP-, TCP/IP-, UDP- and proprietary protocols up to 1000 requests per second and server are supported.
Due to very good experience of analysing non functional runtime aspects during system test, we optimized our complete tool chain to operate smoothly with a rate of numerous 100 million single measurements per day. Even single use case analysis within a data set of numerous billion measurements can be executed.
Past
GRZ IT Center GmbH
GRZ IT Center uses MyARM for their complete financial service multi-tier software infrastructure to measure end-to-end response times. MyARM is used as a highly customisable and efficient ARM infrastructure addresses all technologies and programming languages used in the customer environment. GRZ IT Center uses the following ARM language bindings:
Between 2008 and 2015 GRZ IT Center uses MyARM in a heterogeneous Windows® and Linux® wide area network (WAN) of more than 5000 ARM-instrumented C# clients in bank branches all over Austria. Additionally, around 10 HTTP- and Java-based application servers are part of the monitored system. GRZ IT Center used the following ARM language bindings:
Around 8-10 million response time measurements were processed and analysed per day, using the complete MyARM Enterprise tool chain.
Deutsche Flugsicherung GmbH
Deutsche Flugsicherung GmbH (DFS) uses MyARM to improve the quality control technology of radar data processing. The DFS has instrumented the core functions of its operational radar data processing system PHOENIX to get an insight into the performance of the distributed processing chain.
PHOENIX is the operational radar data processing system (RDPS) at all national and international airports in Germany, with more than 100 deployed air traffic controller working positions (CWP). Thus the system's performance is directly linked with the German air traffic management efficiency, which is of vital interest for the DFS.
The ARM instrumentation of PHOENIX and resulting measurement data analysis provide a detailed insight view of the duration of the important processing steps of PHOENIX. Moreover, an overview could be generated of the whole processing chain starting from the point in time when a plot is received by the tracker until it is presented to the controller at the CWP.
More details on this topic were presented at the CMG 2007 in a cooperation paper between DFS and MyARM explaining the above effects in more detail. Download the paper and slides from our presentation page.
Screenshots
The following screenshots presents the various MyARM analysis web applications. The MyARM browser is used to analyse single and measurement chains, the MyARM RTS browser presents an overview of the run time behaviour of instrumented applications as well as some screenshots of the native MyARM manager application.
MyARM Browser overview

This screenshot displays measurements of a Python CDDB example. Transactions are drawn as colored boxes, the invocation order is indicated by vertical position.

This is a screenshot displaying the calling hierarchy of a Python CDDB example in a sequence diagram.

This is a screenshot displaying the transaction tree in a tabular layout, indicating the calling hierarchy by the indentation level in the table rows.

This is a screenshot displaying the use of a filter acting on the URI (thus selecting measurements for CGI programs). In tree view below we have placed the mouse pointer above a coloured box. The associated transaction name and some measurement data are shown in a hover.

This is a screenshot displaying transaction statistics for those transactions with a response time above or equal to 25.0 ms (the unit default to ms but can be changed via preferences). Note that the diagram area at the bottom can be hidden in order to display larger results in the table.≈‚

This is a screenshot showing a large table with measurements. The widgets on the left and at the bottom have been hidden. Layout-specific information can be saved in the database for reuse.

This is a screenshot showing how almost the whole display are be used for showing the measurement table. All other widgets have been hidden.
MyARM Browser details

The screenshot displays measurements of a Python CDDB example:

The screenshot displays measurements of a Python CDDB example:

The screenshot displays measurements of a Python CDDB example:

The screenshot displays measurements of a Python CDDB example. The sequence diagram shows a complete calling sequence starting with a request in the HTTP server and ending in several requests for fetching track information for CDs

The screenshot displays measurements of a Python CDDB example. The screenshot shows that detailed information can be displayed for any box in the sequence diagram.

The screenshot displays measurements of a Python CDDB example. The user has chosen to first select a ARM system and then the application.

The screenshot displays measurements of a Python CDDB example. The user had first selected a system and then the HTTP application. By setting an appropriate transaction attribute filter, only FAILED transactions are shown in the result table.
MyARM RTS Browser

The screenshot displays an overview of real time statistics for the year 2013 of transaction measurements of a web-site:

The screenshot displays an overview of real time statistics from december 2012 until november 2013 grouped by month of transaction measurements of a web-site:

The screenshot displays a days overview of real time statistics from of april 2013 of transaction measurements of a web-site:

The screenshot displays a hours overview of real time statistics from of 5th april 2013 of transaction measurements of a web-site:
MyARM Manager

The manager with Browser tab opened showing measurements of HTTP transactions of an Apache web server:

The manager with RTSBrowser tab opened showing aggregated statistics of selected measurements of the year 2014 of a web-site.
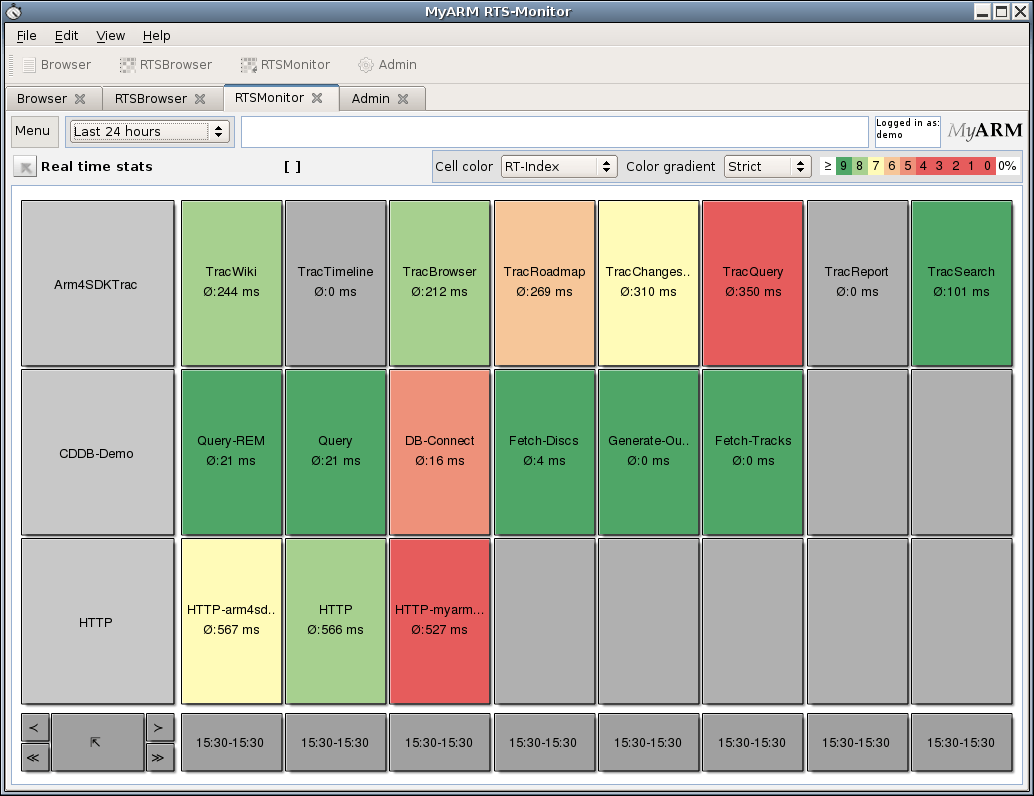
The manager with RTSMonitor tab opened showing aggregated statistics of 'todays' last 24 hours of a web-site

The manager with Admin tab opened showing the configured RTS configuration and some error log messages of a web-site
Parallel 2012

At the Parallel 2012 conference in Karlsruhe, Germany we presented our report on how to measure and visualise parallelism in multi-threaded applications running on multi-core hardware (in german).
QualityConf 2011

At the QualityConf 2011 conference in Munich, Germany we presented our method report about the evolution from performance tests to productive application monitoring (in german). Here you will find the presentation slides:
CMG 2007

At the CMG 2007 in San Diego, CA we presented our customer success story of Deutsche Flugsicherung GmbH (german air traffic control, project Phoenix). Here you will find the paper and the presentation slides:
